Shopping Cart
- Remove All
 Your shopping cart is currently empty

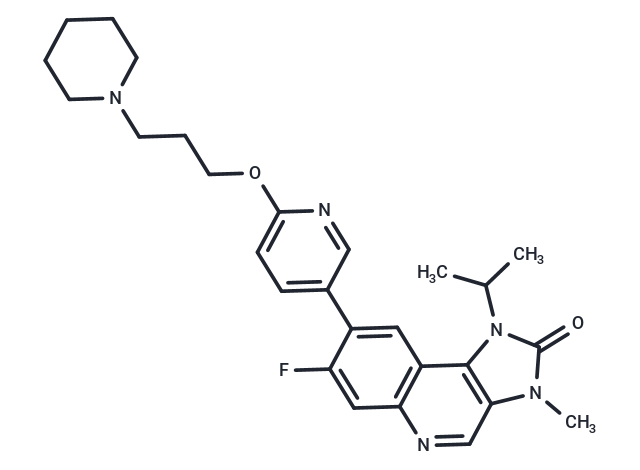
AZD1390 is an exceptionally potent inhibitor of ATM in cells (IC50: 0.78 nM) with >10,000-fold selectivity over closely related members of the PIKK family of enzymes.

| Pack Size | Price | Availability | Quantity |
|---|---|---|---|
| 1 mg | $80 | In Stock | |
| 2 mg | $109 | In Stock | |
| 5 mg | $163 | In Stock | |
| 10 mg | $239 | In Stock | |
| 25 mg | $488 | In Stock | |
| 50 mg | $622 | In Stock | |
| 100 mg | $797 | In Stock |
| Description | AZD1390 is an exceptionally potent inhibitor of ATM in cells (IC50: 0.78 nM) with >10,000-fold selectivity over closely related members of the PIKK family of enzymes. |
| Targets&IC50 | ATM:0.78 nM (cell based) |
| In vitro | ATM autophosphorylation inhibition by AZD1390 occurred at 4 hours after treatment, and 3 nM produced strong inhibition of ATM in LN18 GBM cells. Other DDR inhibitors tested under the same conditions at relevant IC50 concentrations did not affect pATM levels. A dose-dependent increase in G2 accumulation occurred after 24 hours following AZD1390 and irradiation at 2 Gy indicative of cells not arresting in S and accumulating in G2 or experiencing problems during mitosis. |
| In vivo | In in vivo syngeneic and patient-derived glioma as well as orthotopic lung-brain metastatic models, AZD1390 dosed in combination with daily fractions of IR (whole-brain or stereotactic radiotherapy) significantly induced tumor regressions and increased animal survival compared to IR treatment alone. |
| Cell Research | Cells were seeded in six-well plates to a density of 50 to 60% and incubated at 37°C for 24 hours. Cells were pretreated with AZD1390, the ATR inhibitor AZD6738, the Wee1 inhibitor AZD1775, the poly(adenosine diphosphate-ribose) polymerase (PARP) inhibitor olaparib, or the DNA-PK inhibitor KU-0060648 at indicated concentrations for 1 hour and subsequently irradiated at 2 Gy using the Faxitron CellRad (130-kV, 5-mA, 0.5-mm Al). In washout experiments, the cell culture medium was immediately replaced and cells were incubated with or without the compound for 1, 6, and 24 hours. In all other experiments, proteins were collected at indicated time points following irradiation. Proteins were harvested by scraping the cells in radioimmunoprecipitation assay (RIPA) lysis buffer supplemented with protease and phosphatase inhibitors. Protein content was quantified using the BCA Protein Assay Kit according to manufacturing conditions. Proteins were separated by SDS–polyacrylamide gel electrophoresis on 4 to 12% bis-tris or 3 to 8% Tris-acetate gels and transferred onto nitrocellulose membranes using the iBlot Dry Blotting System. Membranes were briefly washed with water and Tris-buffered saline (TBS) with 0.05% Tween 20 (TBST) once and incubated in blocking solution, followed by primary antibodies diluted in TBST with 5% (w/v) nonfat dry milk or 3% bovine serum albumin (BSA) overnight at 4°C with shaking. Membranes were then washed three times and incubated for 1.5 hours with horseradish peroxidase (HRP)–conjugated antibodies and/or LI-COR fluorescent antibodies CW700-800 in TBST with 5% (w/v) nonfat dry milk. Membranes were washed five times with TBST, and proteins were visualized with the Fuji or Syngene G:BOX Imaging System or Film Developer after enhanced chemiluminescence substrate addition. |
| Animal Research | Bioluminescence signaling of implanted 3 × 10^5 NCI-H2228-Luc cells was measured using an IVIS Xenogen imaging machine to monitor tumor growth. When the signal reached the range of 10^7 to 10^8, the mice were randomized into different treatment groups and treated orally with either vehicle or AZD1390 QD or BID + IR at 2.5 Gy daily for four consecutive days. AZD1390 or vehicle was dosed at 1 hour before IR on each dosing day. The bioluminescence signals and body weight of the mice were measured once weekly, and the raw data were recorded according to their study number and measurement date in the in vivo database. TGI from the start of treatment was assessed by comparison of the mean change in bioluminescence intensity for the control and treated groups and presented as % of TGI. The calculation of inhibition and regression was based on the geometric mean of relative tumor volume (RTV) in each group. "CG" means the geometric mean of RTV of the control group, whereas "TG" means the geometric mean of RTV of the treated group. On specific day, for each treated group, the inhibition value was calculated using the following formula: Inhibition% = (CG ? TG) * 100/(CG ? 1). CG should use the corresponding control group of the treated group during calculation. If inhibition was >100%, then regression was calculated using the following formula: Regression = 1 – TG. Statistical significance was evaluated using a one-tailed t-test. Survival benefit was measured by Kaplan-Meier plots at the end of the study. |
| Molecular Weight | 477.57 |
| Formula | C27H32FN5O2 |
| Cas No. | 2089288-03-7 |
| Smiles | CC(C)n1c2c(cnc3cc(F)c(cc23)-c2ccc(OCCCN3CCCCC3)nc2)n(C)c1=O |
| Relative Density. | 1.224 g/cm3 (Predicted) |
| Storage | Powder: -20°C for 3 years | In solvent: -80°C for 1 year | Shipping with blue ice. | |||||||||||||||
| Solubility Information | DMSO: 4.77 mg/mL (9.98 mM), Sonication is recommended. | |||||||||||||||
Solution Preparation Table | ||||||||||||||||
DMSO
| ||||||||||||||||

Copyright © 2015-2025 TargetMol Chemicals Inc. All Rights Reserved.